Table of Contents
Logging
Debugging OSC can be sometimes tedious. OSCulator provides a way to monitor the input data by using the Console Log event or the Quick Look Window.
Console Log
To use this event, choose 'Console Log' in the Event Type column. There are two types of logging:
- Simple Log
- Use it when you want to see every input values logged to the Console application.
- Timed Log
- If your input changes very often, it is better to use the
Timed Logevent because it only logs every seconds to the Console.
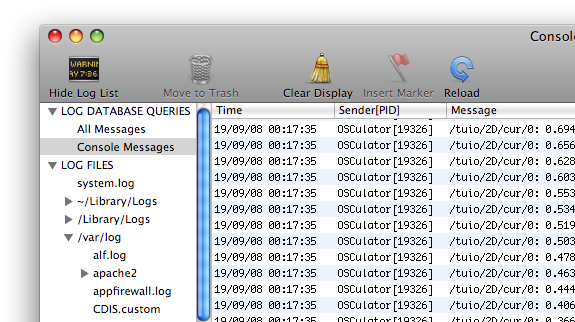
When an OSC message is received, a log entry is written in the System Log. To see it, you can use the system application 'Console.app', located in the /Applications/Utilities folder.
Quick Look Window
The Quick Look makes it even more easy to monitor input values. To display the Quick Look Window, select the message argument you want to monitor, then either press the Space bar, press on the Quick Look toolbar item, or select the Quick Look menu item in the Routings menu.
You can open as many Quick Look Windows as you want, resize and place them on the screen, and also save their position in the document file for later redisplay.
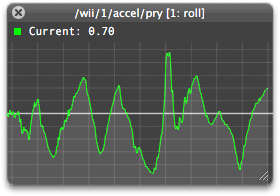
The Quick Look window displays the input with a real time graph. The abcissa spans a duration of 10 seconds, and the ordinate shows values from 0.0 to 1.0 with a fixed scale. The most recent activity is shown on the right, scrolling to the left.
On the top left, there is an activity indicator glowing green when input activity is detected1), and resting grey when no input is received. In the previous picture, the roll parameter of a Wiimote is displayed, showing that messages are sent continuously.
The horizontal line drawn with a lighter grey shows the value 0.5, value at which triggered events2) are fired.
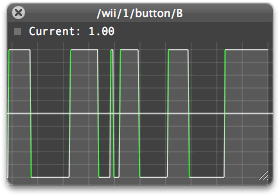
When a message doesn't change, the graph line keeps its current values, and is drawn in grey reflecting the color of the activity monitor:
To dispose the Quick Look window, either click on the close button, or press the Space bar.


